Obesity Levels Analysis - Impact Overall Health Based on Eating Habits and Physical Activities Using SQL.
- angelamar1708
- Sep 6, 2024
- 11 min read
Updated: Oct 4, 2024

INTRODUCTION
The Obesity Levels project aims to analyze different types of obesity based on the physical conditions and eating habits that may influence their impact on individuals. By uncovering insights and trends, we seek to understand the factors contributing to obesity. The data transforming and analysis will be conducted using Structured Query Language (SQL-MySQL Workbench).
OBJECTIVE
The main objective of this project is to understand the different factors that affect how dietary choices and physical activity impact obesity levels in individuals, and then to establish recommendations based on the identified factors.
PREPARING DATA
This dataset includes data for estimating obesity levels in individuals from Mexico, Peru, and Colombia, it comprises 17 attributes and 2111 records. The records are labeled with the class variable 'NObesity' (Obesity Level), which enables the classification of data into categories: Insufficient Weight, Normal Weight, Overweight Level I, Overweight Level II, Obesity Type I, Obesity Type II, and Obesity Type III. 77% of the data was synthetically generated using the Weka tool and the SMOTE filter, while 23% was collected directly from users via a web platform.
Gender: Feature, Categorical, "Gender"
Age: Feature, Continuous, "Age"
Height: Feature, Continuous
Weight: Feature Continuous
family history with overweight: Feature, Binary, " Has a family member suffered or suffers from overweight?"
FAVC: Feature, Binary, " Do you eat high caloric food frequently? "
FCVC: Feature, Integer, " Do you usually eat vegetables in your meals? "
NCP: Feature, Continuous, " How many main meals do you have daily? "
CAEC: Feature, Categorical, " Do you eat any food between meals? "
SMOKE: Feature, Binary, " Do you smoke? "
CH2O: Feature, Continuous, " How much water do you drink daily? "
FAF: Feature, Continuous, " How often do you have physical activity? "
TUE: Feature, Integer, " How much time do you use technological devices such as cell phone, videogames, television, computer and others? "
CALC: Feature, Categorical, " How often do you drink alcohol? "
MTRANS: Feature, Categorical, " Which transportation do you usually use? "
NObeyesdad : Target, Categorical, "Obesity level.
SCC: Feature, Binary, " Do you monitor the calories you eat daily? "
Questions to lead the aim and write the SQL codes.
What is the average Weight and Height of individuals by gender?
How many people have family members with overweight?
What usage rate of different types of transportation?
How many people smoke by gender?
How many people have normal weight?
What is the average number of main meals (NCP) consumed daily for individuals by obesity level (NObeyesdad)?
What is the average water drink per day by obesity level?
How many people consume high calories food frequently by Obesity levels?
What is the average of vegetable consumption?
How many people who eat any food between meals?
what is the average of physical activity?
How many people frequently consume alcohol by Obesity Levels?
Calculate the BMI. formula (weight / height * height).
Count people by "Obesity level"
How many people who monitor the calories.
CLEANING PROCESS
The screenshots below illustrate the step-by-step cleaning process performed in MySQL.


ANALYSIS PROCESS
Based on the questions we set before, that will guide us to answers fulfilling the project's goals.
What is the average Weight and Height of individuals by gender (rounded to two decimals)
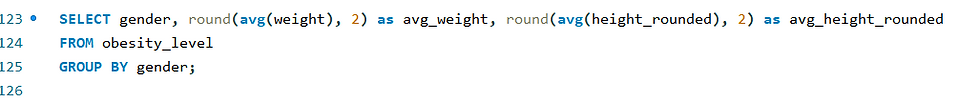

The average Weight for Male is 91.11 Kg and for Female is 82.59 Kg.
The average Height for Female is 1.64m and for Male is 1.76m.
Males have higher average Weight and Height than female.


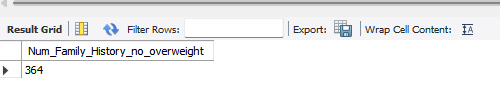
Among the total individuals, 1720 (83%) have a family member with overweight, while 364 (17%) do not have a family member with overweight. This means the majority have them.


Obesity Type I has the highest count with family members with overweight at 344, indicating a significant number of individuals in this category. Obesity Type III and Obesity Type II also have high counts (324 and 296 respectively), showing a concerning trend towards higher number. Overweight Level II and Overweight Level I have 270 and 209 individuals respectively, which are also substantial number. Normal Weight has 152 individuals, which is lower compared to the overweight and obesity categories. Insufficient Weight has the lowest count at 125.
3. What is the usage rate of different types of transportation?

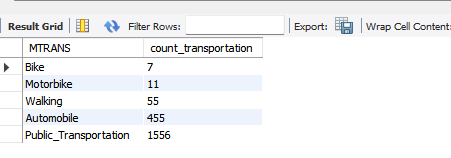
The data shows a clear preference for public transportation, with 1556 (75%) of people using it. Automobiles are the second most popular mode of transport at 455 (21%), while walking 55 (3%), motorbikes 11 (1%), and bikes make up a small fraction of the total.
4. How many people smoke by gender?


There are a total of 15 females who smokes and 1018 who do not. Among males, 29 smoke while 1022 do not. So, the data indicates that smoking is relatively uncommon among both females and males, with a higher prevalence among males.
5. How many people have normal weight by gender?


There is only 282 people with normal or healthy weight; 145 males and 137 females, this represents 14% of total surveyors.
6. What is the average number of main meals (NCP) consumed daily for individuals by obesity level (NObeyesdad)?


Obesity Type I individuals have the lowest average number of meals per day at 2.4 while the other at overweight level I average 2.6 meals. Individuals with normal weight average 2.7 meals, and those with insufficient weight have 3.0 meals per day, which is higher than those with more weight. People with obesity type III average 3 meals per day, and those with obesity type II average 2.7 meals. This indicates that the number of meals does not always directly influence or impact a person's weight.
7. What is the average water drink per day by obesity level?

On average, individuals drink more than one glass of water per day. Those with Obesity Type III lead the statistics, consuming an average of 2.3 glasses daily, followed by individuals with Obesity Type I at 2.1 and Overweight Level III at 2.0. Conversely, people with Obesity Type II and those of Normal Weight tend to drink less water. Individuals classified as underweight consume the least, with an average of just 1.9 glasses per day.
8. How many people frequently consume high calories food by Obesity levels?


The majority of individuals consume frequently high-calorie foods, with over 88% of respondents indicating they do so, while only 12% report they do not. Among those categorized as Overweight Level I, and Obesity Types I, II, and III, high-calorie consumption is particularly prevalent. This pattern of eating could significantly impact their weight and overall health. Consistent overconsumption can lead to serious health problems. It’s important to balance calorie intake with physical activity and choose nutrient-dense foods to maintain overall health.

The results above show that most people consume vegetables per day, people with Obesity Type III consumed the most with an average of 3.0. followed by insufficient weight with an average of 2.5. Obesity Type II with 2.4, Normal weight 2.3 Overweight Level I 2.3, Overweight Level II 2.2, Obesity Type I 2.2. While some individuals are close to or meeting the recommended vegetable intake, there is a general trend of under-consumption, particularly among those with normal weight and various levels of overweight and obesity.
10. How many people eat any food between meals?

The results above indicates that Normal Weight individuals have a balanced distribution across all frequencies of snacking. Obesity Types I, II, and III show a high number of individuals who sometimes snack, indicating a potential pattern of irregular snacking habits. And Insufficient Weight and Overweight Levels I and II also show significant numbers of people who sometimes snack, suggesting that irregular snacking is common across various weight categories.
11. what is the average of physical activity?

Let's break this down: Insufficient Weight (1.3) and Normal Weight (1.3) categories have the highest average physical activity levels. This suggests that individuals in these categories are generally more active. Overweight Level I (1.1) also show a relatively high level of physical activity, though slightly lower than the Normal and Insufficient Weight categories. Obesity Type I, II (1.0) have similar average activity levels, which are lower than those in the Normal and Overweight Level I categories. Overweight Level II (1.0) shows a slight decrease in physical activity compared to Overweight Level I. Obesity Type III (0.6) has the lowest average physical activity level, indicating that individuals in this category are the least active.
Higher physical activity is associated with Normal and Insufficient Weight categories.
Lower physical activity is more common in the higher obesity categories, particularly Obesity Type III.

The highest frequency of "No" responses was observed in Obesity Type I (165 individuals). The most "Sometimes" responses were recorded for Obesity Type III (323 individuals). The "Frequently" responses were least common among those with Insufficient Weight (1 individual) and Obesity Type II (2 individuals) in each category.
People with Obesity Type III are most likely to drink alcohol “Sometimes.” People with Obesity Type I are most likely to abstain from alcohol. The “Frequently” category has the lowest numbers across all weight categories, indicating that frequent alcohol consumption is less common.
13. Calculate the BMI. formula (weight / height * height) by Obesity levels.

The Body Mass Index (BMI) is a straightforward formula used to determine if an individual has a healthy body weight for their height. Here is the method for calculating it:
BMI= Weight (kg)/ height (m)^2
Underweight: BMI < 18.5
Normal weight: BMI 18.5–24.9
Overweight: BMI 25–29.9
Obesity: BMI ≥ 30
The data reveals the following trends:
Both males and females with insufficient weight have similar average BMIs (around 17.33 - 17.5).
As the obesity level increases, the average BMI also increases for both genders.
Males have a higher average BMI in the Obesity Type III category (49.47) compared to females (42.26).
How many people are in each s category of obesity level?

Those with Obesity Type I were the most numerous, totaling 351, which is 17%. This was followed by Obesity Type III with 324 individuals, accounting for 16%, and Obesity Type II with 297 individuals, representing 14%. Normal weight individuals numbered 282, making up 13%, while those simply overweight level II with 288, equating to 14%. There were 266 individuals with insufficient weight and overweight level I, 276 with similar percent.
Count people who monitor the calories.


The data shows that the prevalence of individuals not monitoring their calorie intake is higher among those with greater levels of obesity (Obesity Type I, II, and III). There is a discernible trend where the number of SCC 'no' responses diminish as the level of obesity decreases, indicating a possible correlation between higher obesity levels and not tracking calorie intake.
KEY INSIGHTS
Weight and Height Differences: Males have a higher average weight (91.10 kg) and height (1.76 m) compared to females, who average 82.57 kg in weight and 1.64 m in height.
Family History of Overweight: A significant majority (83%) of individuals have a family member who is overweight, indicating a potential genetic or environmental influence on weight. And There is only 282 people with normal or healthy weight; 145 males and 137 females, this represents 14% of total surveyors.
Obesity and Overweight Prevalence: Obesity Type I is the most common category among those with overweight family members, followed by Obesity Type III and II. This trend highlights a concerning prevalence of higher obesity levels.
Transportation and Physical Activity: Most individuals use public transportation (75%), with a smaller percentage using automobiles (21%) and even fewer walking or biking. This suggests a potential area for increasing physical activity through active transportation methods.
Smoking Habits: Smoking is relatively low among both females (15 smokers) and males (29 smokers), with the majority not smoking.
Number of meals and Weight: Individuals with normal or insufficient weight tend to have more meals per day compared to those with higher weight categories, indicating that number of meals alone does not directly correlate with weight.
Water Consumption: On average, individuals drink more than one glass of water per day, with those in the Obesity Type III category consuming the most. This suggests that higher water intake is common among those with higher obesity levels. But it does not represent sufficient water for all weights level.
Calorie Consumption: The majority of individuals consume high-calorie foods, with over 88% of respondents indicating they do so, while only 12% report they do not, among those categorized as Overweight Level I, and Obesity Types I, II, and III, high-calorie consumption is particularly prevalent. This pattern of eating could significantly impact their weight and overall health.
Vegetable Consumption: Most individuals consume vegetables daily, with those in the Obesity Type III category consuming the most, followed by those with insufficient weight.
Snacking consumption: Normal Weight individuals have a balanced distribution across all frequencies of snacking. Obesity Types I, II, and III show a high number of individuals who sometimes snack, indicating a potential pattern of irregular snacking habits. And Insufficient Weight and Overweight Levels I and II also show significant numbers of people who sometimes snack, suggesting that irregular snacking is common across various weight categories.
Physical Activity Levels: Higher physical activity levels are associated with normal and insufficient weight categories, while lower activity levels are more common in higher obesity categories, particularly Obesity Type III. This can have a huge impact in the reason why many of them are overweight.
Alcohol Consumption: A general analysis of alcohol consumption across all categories reveals that 69 people (3%) drink frequently, 635 individuals (30%) abstain completely, 1379 (66%) drink sometimes, and only 1 person with normal weight (less than 1%) drink always. The highest number of "Sometimes" responses was observed in individuals with Obesity Type III (323 individuals), which could significantly impact their body weight.
The Body Mass Index: Both males and females with insufficient weight have similar average BMIs (around 17.33 - 17.5). As the obesity level increases, the average BMI also increases for both genders. Males have a higher average BMI in the Obesity Type III category (49.47) compared to females (42.26).
Obesity category: From the data, we can observe that the highest percentage of individuals fall into the Obesity Type I category, making up 17% of people. This is closely followed by Obesity Type III at 16%. The categories of Obesity Type II, Overweight Level II, and Normal Weight each account for 14% of people. Overweight Level I and Insufficient Weight categories have the lowest percentages, each comprising 13% of people.
Calorie tracking: the data indicate g a possible correlation between higher obesity levels and not tracking calorie intake.
RECOMENDATIONS
Promote Active Transportation: Promoting walking, biking, and other forms of active transportation can boost physical activity levels in the population. It's beneficial to encourage these activities on specific days or whenever it's most convenient, aiming for at least a 20 to 60-minute walk or bike ride once a week.
Family-Based Interventions: Develop better habits that address family-based lifestyle changes, considering the high prevalence of overweight family members.
Nutritional Education: Provide education on balanced meal frequency and healthy eating habits, emphasizing the importance of nutrient-dense foods over meal quantity, high protein meals and low carb-sugar consumption.
Hydration Awareness: Promote the benefits of adequate water intake, especially among those with lower consumption levels, drink at least one to two liters per day, it also depends on the body weight.
Physical Activity Awareness: Implement targeted physical activity programs for individuals in higher obesity categories to help increase their activity levels focus on high intensity training at least twice or three times per week.
awareness of high calorie consumption: Offer tools and resources to support calorie tracking, particularly for those in higher obesity categories who may benefit the most.
Vegetable Intake Encouragement: Encourage higher vegetable consumption across all weight categories, highlighting its benefits for overall health. Also focusing on vegetable high protein consumption.
Alcohol Awareness: Educating individuals about the effects and harm that frequent alcohol consumption can cause to their health.
Obesity Category: Given that a significant portion of the population falls into the obesity categories (Type I, II, and III), targeted health interventions are crucial. Programs focusing on weight management, healthy eating, and physical activity should be prioritized. Although a smaller percentage, the 13% of individuals in the insufficient weight category should not be overlooked. Providing support through nutritional guidance and addressing any underlying health issues is important. This could include personalized diet plans, physical activity programs.
Calorie tracking: The data suggest a potential correlation between higher levels of obesity and the lack of calorie intake tracking. Calorie tracking is an essential aspect of managing obesity and sustaining a healthy weight. Through vigilant monitoring of calorie consumption, individuals are empowered to make knowledgeable dietary choices that contribute to improved health outcomes.
The link below provides access to the full queries:


Comments