Tableau Visualizations: Obesity Levels Analysis - Impact Overall Health Based on Eating Habits and Physical
- angelamar1708
- Sep 6, 2024
- 5 min read
Updated: Oct 3, 2024
INTRODUCTION
This project visualizes data from the previous ‘Obesity Level’ project, originally developed in SQL, using Tableau. It highlights the powerful impact of data visualization in uncovering insights, organizing information, and enhancing our understanding through various visualization techniques
OBJECTIVE
The objective of this project is to create visualizations for the Obesity Levels analysis to provide a better understanding of the impact of health based on eating habits and physical activities. Through various charts and pie charts, we aim to illustrate the relationships and trends within the data.
DATA INFORMATION
This dataset includes data for estimating obesity levels in individuals from Mexico, Peru, and Colombia, it comprises 17 attributes and 2111 records. The records are labeled with the class variable 'NObesity' (Obesity Level), which enables the classification of data into categories: Insufficient Weight, Normal Weight, Overweight Level I, Overweight Level II, Obesity Type I, Obesity Type II, and Obesity Type III. 77% of the data was synthetically generated using the Weka tool and the SMOTE filter, while 23% was collected directly from users via a web platform.
Questions to Guide the Aim of the Visualizations
What is the average Weight and Height of individuals by gender?

The average weight for females is 82.5 kg and 91.1 kg for males, while the average height is 1.64 meters for females and 1.76 meters for males.
How many people have family members with overweight?

The bar chart titled “Family History with Overweight and Obesity Level” provides a visual representation of the relationship between family history and various levels of overweight and obesity. The chart categorizes individuals into four groups based on their family history. Among the total individuals, 5,160 (85%) have a family member with overweight, while 1,092 (17%) do not have a family member with overweight. This means the majority have them.
3. what is the usage rate of different types of transportation?

The data shows a clear preference for public transportation, with 1558 (75%) of people using it. Automobiles are the second most popular mode of transport at 456 (21%), while walking 55 (3%), motorbikes 11 (1%), and bikes (7) make up a small fraction of the total.
4. How many people smoke by Obesity Level?

The data indicates that smoking is relatively uncommon among all obesity Levels
in all obesity categories, the number of non-smokers is consistently higher than the number of smokers. The increasing number of smokers in higher obesity categories could indicate compounded health risks, as both smoking and obesity are significant risk factors for various health conditions.
6. What is the average number of main meals (NCP) consumed daily for individuals by obesity level (NObeyesdad)?

Obesity Type I individuals have the lowest average number of meals per day at 2.4 while the other at overweight level I average 2.5 meals. Individuals with normal weight average 2.7 meals, and those with insufficient weight have approximately 3.0 meals per day, which is higher than those with more weight. People with obesity type III average 3 meals per day, and those with obesity type II average 2.7 meals. This indicates that the number of meals does not always directly influence or impact a person's weight.
7. What is the average water drink per day by obesity level?

On average, individuals drink more than one glass of water per day. Those with Obesity Type III lead the statistics, consuming an average of 2.2 glasses daily, followed by individuals with Obesity Type I at 2.1 and Overweight Level III at 2.0. Conversely, people with Obesity Type II and those of Normal Weight tend to drink less water. Individuals classified as underweight consume the least, with an average of just 1.9 glasses per day.
8. how many people who frequently consume high calories food by Obesity levels.
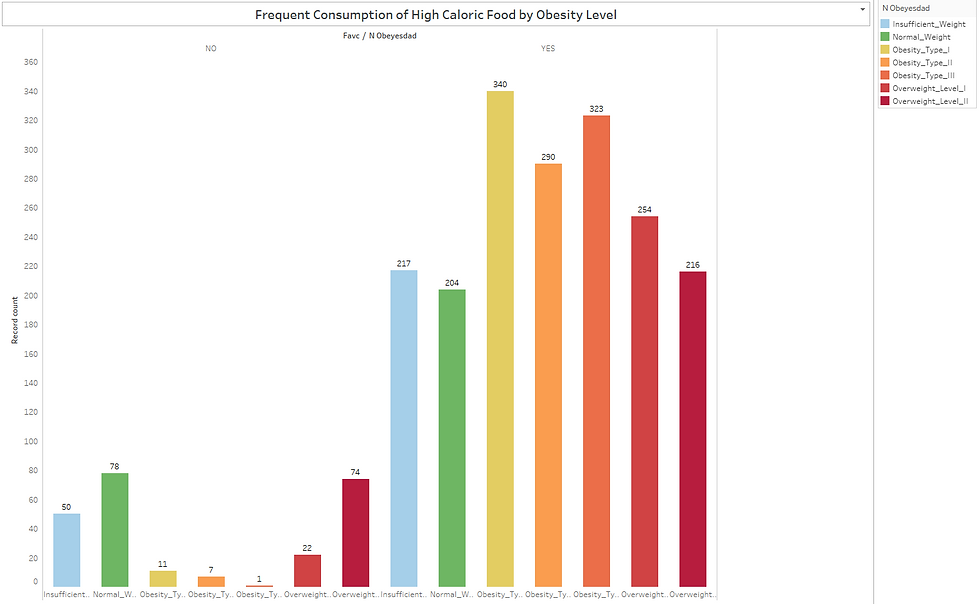
The majority of individuals consume frequently high-calorie foods, with over 88% of respondents indicating they do so, while only 12% report they do not. Among those categorized as Overweight Level I, and Obesity Types I, II, and III, high-calorie consumption is particularly prevalent. This pattern of eating could significantly impact their weight and overall health. Consistent overconsumption can lead to serious health problems. It’s important to balance calorie intake with physical activity and choose nutrient-dense foods to maintain overall health.

The chart shows that individuals in the Overweight Level I category have the highest average vegetable consumption (3.03 servings), while those in the Normal Weight category have the lowest (2.10 servings). This suggests that there is no clear linear relationship between obesity levels and vegetable consumption.
10. How many people frequently eat any food between meals?

The chart above indicates that Normal Weight individuals have a balanced distribution across all frequencies of snacking. Obesity Types I, II, and III show a high number of individuals who sometimes snack, indicating a potential pattern of irregular snacking habits. And Insufficient Weight and Overweight Levels I and II also show significant numbers of people who sometimes snack, suggesting that irregular snacking is common across various weight categories.
11. what is the average of physical activity?

Insufficient Weight and Normal Weight categories have the highest average physical activity levels. This suggests that individuals in these categories are generally more active. Overweight Level I also show a relatively high level of physical activity, though slightly lower than the Normal and Insufficient Weight categories. Obesity Type I, II have similar average activity levels, which are lower than those in the Normal and Overweight Level I categories. Overweight Level II shows a slight decrease in physical activity compared to Overweight Level I. Obesity Type III has the lowest average physical activity level, indicating that individuals in this category are the least active.
Higher physical activity is associated with Normal and Insufficient Weight categories.
Lower physical activity is more common in the higher obesity categories, particularly Obesity Type III.
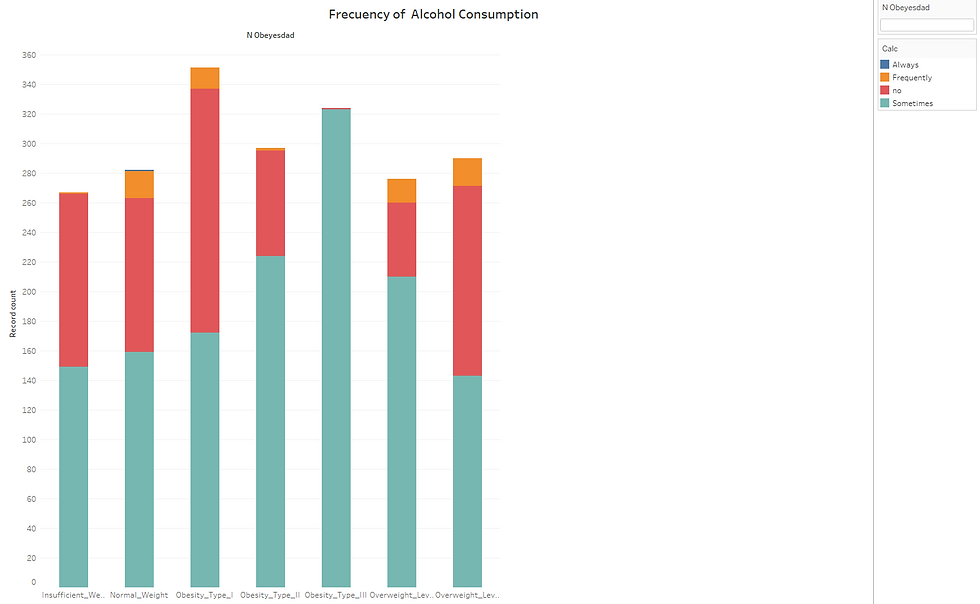
The highest frequency of "No" responses was observed in Obesity Type I (165 individuals). The most "Sometimes" responses were recorded for Obesity Type III (323 individuals). The "Frequently" responses were least common among those with Insufficient Weight (1 individual) and Obesity Type II (2 individuals) in each category.
People with Obesity Type III are most likely to drink alcohol “Sometimes.” People with Obesity Type I are most likely to abstain from alcohol. The “Frequently” category has the lowest numbers across all weight categories, indicating that frequent alcohol consumption is less common.
What is the percent of each category of obesity level?

Those with Obesity Type I were the most numerous 16.8%. This was followed by Obesity Type III accounting for 15.52%, and Obesity Type II representing 14.2%. Normal weight individuals making up 13.5 %, while those simply overweight level II equating to 14%. Individuals with insufficient weight 12,7% and overweight level I, 13.2% with similar percent.
DASHBOARD


Access the Full Analysis on Tableau Public:


Comments