Market Analysis of Hass Avocados: Making Informed Marketing Decisions Using Microsoft Excel.
- angelamar1708
- Sep 6, 2024
- 10 min read
Updated: Oct 4, 2024

Introduction
The Avocado Hass Project is designed to examine the various trends and patterns in avocado sales and pricing from January 1, 2015, to March 26, 2018. Utilizing Microsoft Excel for data transforming and analysis; the project seeks to provide insight into factors that affect the avocado market dynamics across various regions in the United States. Key insights include understanding the temporal sales behavior, consumer preferences for avocado types, and the regions with the highest sales, which are crucial for enhancing trend analysis and decision-making.
Objectives
Understanding the behavior of average prices is crucial, as is identifying trends in sales volume and their correlation with price changes. Analyzing the variations in avocado sales and prices across different cities, and comparing the sales and prices of conventional versus organic avocados, the total revenue through time, total bags, and insights on descriptive statistics Average price are therefore our primary objectives:
Questions To Lead the aims
How does the volume compare between Conventional and Organic?
What is the average price of avocados and how does it vary over time?
Can we segment the market based on consumer behavior—for instance, do some regions prefer organic over conventional avocados and does the price has any influence on their preference?
what is the maximum volume sale each month and what month has the highest sold?
how is the revenue behavior through the time?
What is the correlation between Total Volume with the Average Price and the Total Volume with the Total Revenue?
show insights about the statistical descriptive of Average Price (mean, standard error, median, mode, standard deviation, Sample Variance, Kurtosis, Skewness, Range, Minimum, Maximum, sum and count) of Total Revenue, Average Price and Total Volume.
Preparing the Data
For our analysis, we'll utilize the Avocado Hass prices dataset, created by Justin Kiggins and available under a CCO license. This public dataset delves into the historical prices and sales volume of avocados in the US and is furnished by the Avocado Hass Board. It encompasses all the requisite data needed for our study.
Date: The date of the observation.
Average Price: the average price of a single avocado.
Total Volume: Total number of avocados sold.
Type: conventional or organic.
Year: the year.
Region: the city or region of the observation
Total Volume: Total number of avocados sold.
4046: Total number of avocados with PLU 4046 sold.
4225: Total number of avocados with PLU 4225 sold.
4770: Total number of avocados with PLU 4770 sold.
small bags: Total number of small bags.
Medium bags: Total number of medium bags.
X-large Bags: Total number of extra-large bags.
Total bags: Total bags.
Cleaning Process
.
Identified and removed any duplicate rows to ensure data integrity using the Ctrl A to select the data, then go to the data frame and check for duplicates and not duplicates were found.
Trimmed any leading or extra spaces in the data to avoid inconsistencies using =TRIM (text).
Removed the first column as it was not necessary for the analysis.
Verified and corrected the Total Volume values as there were discrepancies in the totals in the raw dataset so eliminate the old column and create a new one with the accurate data summarizing 4046, 4225 and 4770 for Total Volume.
Created a new column for Total Bags by summing the values of Small Bags, Large Bags, and X-Large Bags.
Extracted and Added a Year column by extracting the year from the Date column, using the YEAR function. Then added a Month column by extracting the month from the Date column using the MONTH function.
Changed the "Region" column to reflect specific "city" instead of broader regions like "US_Total", "North", "East", "West", "Mid_south", "California", "Southcentral", "southeast", "northeast".
Dropped rows where the region information was ambiguous or not useful for the analysis (e.g., “Which State are part of East?”).
Added a new column Total Revenue by multiplying Total Volume by Average Price.
Analysis Process
Base on the questions set in order to led to the answers for the objective of this project, and to perform the analysis, I utilize pivot tables to transform and analyze the data.
How does the volume compare between Conventional and Organic through time?
Date / Quarters | Conventional | Organic | Grand Total |
|---|---|---|---|
Qtr1 | 1,065,892,619 | 14,593,969 | 1,080,486,589 |
Qtr2 | 818,904,509 | 17,597,043 | 836,501,552 |
Qtr3 | 713,652,789 | 13,394,973 | 727,047,761 |
Qtr4 | 632,864,309 | 10,982,385 | 643,846,694 |
Grand Total | 3,231,314,226 | 56,568,370 | 3,287,882,596 |

The graphic above illustrates a significant difference in the total volume of conventional avocados compared to organic ones. It also displays the total volume from January 2015 to March 2018, segmented into four quarters. The first year shows the highest volume with a total of 1,065,892,619 for conventional avocados. Throughout the entire period, this accounted for 3,231,422,226, representing 98% of the total volume. In contrast, organic avocados had a volume of 56,568,370, which is 2% of the total volume, indicating a consumer preference for conventional avocados.
So, let's check the graphic below to see if the average price has any influence of the customers preferences answering to our second question of the aims of this project.
2. What is the average price of avocados and how does it vary over time?
Date/ Quarters | Conventional | Organic | Grand Total |
Qtr1 | $ 1.07 | $ 1.54 | $ 1.26 |
Qtr2 | $ 1.13 | $ 1.60 | $ 1.34 |
Qtr3 | $ 1.25 | $ 1.74 | $ 1.47 |
Qtr4 | $ 1.21 | $ 1.68 | $ 1.43 |
Grand Total | $ 1.16 | $ 1.64 | $ 1.37 |

The graphic above indicates that the average price over time does not show significant variation. The price increased slightly, starting at 1.07 for the first quarter, then rising to $1.13, $1.25, and dropping to $1.21, with a total average of $1.16 for conventional products. For organic products, the pattern is similar, with prices starting at $1.54, increasing to $1.60, peaking at $1.74, and then decreasing to $1.68, resulting in a total average of $1.64. Thus, the average price difference between the two categories is approximately $0.48.
Let's examine the variation in prices across different cities to determine if it influences people's preferences, which may guide us to our next objective.
3. Can we segment the market based on consumer behavior—do some cities prefer conventional over organic avocados and does the price has any influence on their preference?
First, let's check the average prices for organic and conventional avocados in the different cities:
City | conventional | organic | Grand Total |
Albany | $1.35 | $1.79 | $1.56 |
Atlanta | $1.07 | $1.61 | $1.33 |
Boise | $1.08 | $1.61 | $1.33 |
Boston | $1.30 | $1.75 | $1.52 |
Charlotte | $1.28 | $1.95 | $1.60 |
Chicago | $1.37 | $1.75 | $1.55 |
Columbus | $1.07 | $1.44 | $1.25 |
Denver | $1.07 | $1.35 | $1.21 |
Detroit | $1.12 | $1.44 | $1.27 |
Grand Rapids | $1.33 | $1.72 | $1.51 |
Great Lakes | $1.18 | $1.50 | $1.34 |
Houston | $0.83 | $1.26 | $1.04 |
Indianapolis | $1.14 | $1.49 | $1.31 |
Jacksonville | $1.19 | $1.84 | $1.50 |
Louisville | $1.11 | $1.47 | $1.28 |
Nashville | $1.01 | $1.41 | $1.20 |
New York City | $1.40 | $2.07 | $1.73 |
Northern-New England | $1.26 | $1.70 | $1.47 |
Orlando | $1.21 | $1.75 | $1.42 |
Philadelphia | $1.40 | $1.90 | $1.59 |
Phoenix-Tucson | $0.73 | $1.72 | $1.11 |
Pittsburgh | $1.25 | $1.50 | $1.35 |
Plains | $1.17 | $1.71 | $1.37 |
Portland | $1.05 | $1.51 | $1.22 |
Richmond-Norfolk | $1.12 | $1.42 | $1.24 |
Roanoke | $1.10 | $1.32 | $1.18 |
Sacramento | $1.27 | $1.92 | $1.52 |
Seattle | $1.17 | $1.64 | $1.35 |
Spokane | $1.12 | $1.67 | $1.33 |
St Louis | $1.19 | $1.59 | $1.34 |
Syracuse | $1.39 | $1.68 | $1.50 |
Tampa | $1.20 | $1.53 | $1.33 |
West -Texas | $0.84 | $1.70 | $1.17 |
Grand Total | $1.16 | $1.63 | $1.37 |

The initial graphic illustrates the stark differences in average prices between conventional and organic avocados in certain cities. For instance, in Hartford and Springfield, organic units are priced at $2.25 compared to $1.41 for conventional units. In San Francisco, the prices are $2.15 for organic and $1.40 for conventional units, while in New York City, they are $2.07 for organic and $1.40 for conventional units. This trend of organic avocados being pricier than their conventional counterparts is consistent across the other cities as well.
Second, check the Total Volume sold per city:
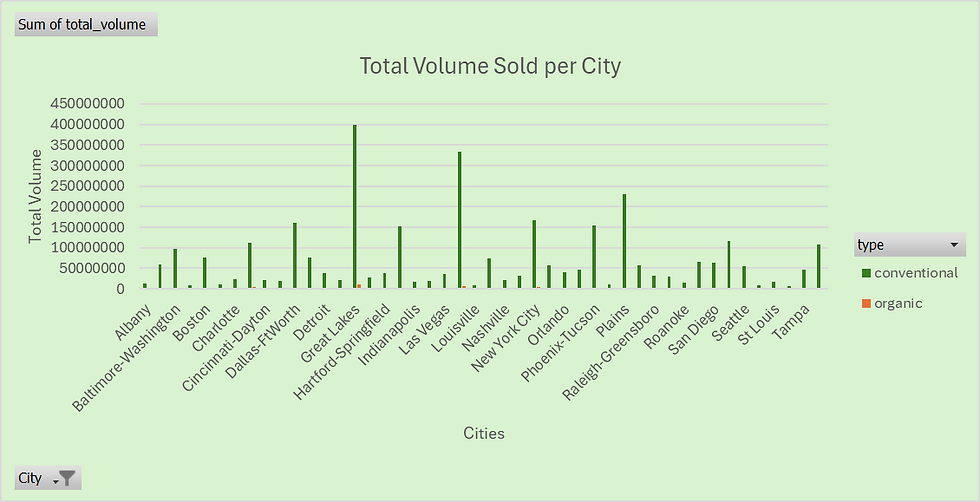
So, now we can have a better picture about the customer behavior related to preferences between conventional and organic; prices have a significantly influence, so this is why the conventional avocado Total Volume represents the 98% of the Total compared to 2% for organic. Greate Lakes and Las Vegas are the cities with the maximum Volume. It is important to consider that probably some customers do not have any preference for organic avocados due to health consciousness or environmental concerns.
Now, let's continue with our next aim, which is:
4. What is the Total Volume sale each month and what month has the highest sold?
Month | conventional | organic | Grand Total |
January | 1,240,973,776 | 12,694,231 | 1,253,668,007 |
February | 1,245,554,669 | 12,630,148 | 1,258,184,817 |
March | 1,122,949,670 | 14,998,454 | 1,137,948,124 |
April | 867506995 | 15712770 | 883219764 |
May | 1058844543 | 18715553 | 1077560096 |
June | 847137714 | 13963334 | 861101047 |
July | 906818258 | 14150537 | 920968795 |
August | 816759022 | 12860785 | 829619806 |
September | 702196062 | 10440489 | 712636551 |
October | 719129118 | 10740462 | 729869580 |
November | 671420243 | 9894788 | 681315031 |
December | 741166489 | 8975645 | 750142134 |
Grand Total | 10940456559 | 155777194 | 11096233753 |

Grand Total for the Period (January 2015 to March 2015)
February records the highest avocado sales, totaling 1,253,668,007 units—1,240,973,776 conventional and 12,694,231 organics. Conversely, November sees the lowest sales, with 681,315,031 units—671,420,243 conventional and 9,894,788 organics. These figures represent the total sales monthly from January 2015 to March 2018.
5. how is the Total Revenue behavior through the time?
Date / Quarters | Conventional | Organic | Grand Total |
Qtr1 | $ 3,566,315,960 | $58,214,313 | $3,624,530,273 |
Qtr2 | $2,898,992,454 | $72,872,861 | $ 2,971,865,315 |
Qtr3 | $ 2,857,172,305 | $61,596,493 | $2,918,768,798 |
Qtr4 | $2,417,087,780 | $ 48,958,039 | $2,466,045,819 |
Grand Total | $ 11,739,568,499 | $241,641,706 | $ 11,981,210,205 |

The graphic above illustrates the Total Revenue for the project focus period on, segmented into four quarters: to calculate the Total Revenue, we multiply the Total Volume with the Average price for each Type. Conventional products consistently generate significantly higher revenue compared to organic products across all quarters representing 98% and 2%. Qtr1 shows the highest total revenue, indicating a strong start to the period. and Qtr4 has the lowest total revenue, suggesting a decline towards the end of the year. Another observed pattern is that, while the revenue from organic avocados is significantly lower than that from conventional ones, there is a modest increase in the second quarter before a decline in the fourth quarter.
6. What is the correlation between Total Volume with the Average Price and the Total Volume with the Total Revenue?

The correlation result between Total Volume and Average Price is -0.19197, indicating a negative correlation. This means that as Total Volume increases, Average Price tends to decrease, and conversely. They are not strongly related; the weak negative correlation suggests that changes in Total Volume might slightly influence Average Price, but the effect is not significant.
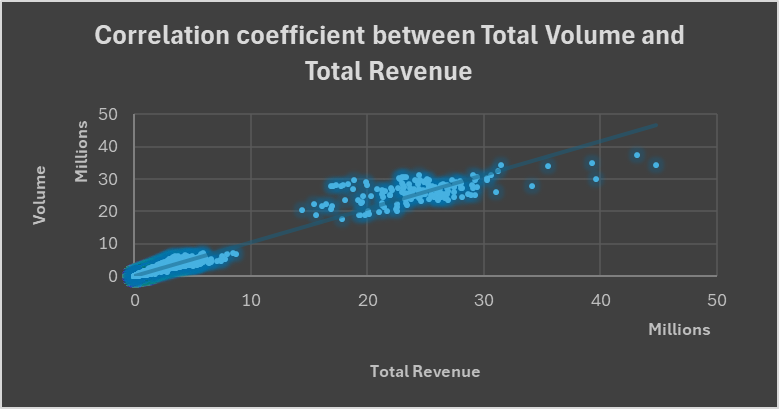
The correlation between Total Volume and Total Revenue is 0.986389, indicating a strong positive correlation nearly equal to 1. This suggests that as Total Volume increases, revenue also increases, implying that higher sales volumes are closely linked to higher revenues. With such a robust correlation, we can predict total revenue with considerable accuracy based on total volume, which is beneficial for forecasting and planning. Additionally, this strong correlation may suggest that the pricing strategy is consistent, without significant discounts or price fluctuations impacting revenue. It also indicates that market demand is stable, allowing the business to depend on volume to generate revenue.
The last but not the least important objective of this project is to:
7. show insights about the Statistical Descriptive of Average Price (mean, standard error, median, mode, standard deviation, Sample Variance, Kurtosis, Skewness, Range, Minimum, Maximum, sum and count).
Average price | |
|---|---|
Mean | $ 1.37 |
Standard Error | 0.003031214 |
Median | 1.33 |
Mode | 1.15 |
Standard Deviation | 0.387983488 |
Sample Variance | 0.150531187 |
Kurtosis | 0.161991677 |
Skewness | 0.550354092 |
Range | 2.81 |
Minimum | 0.44 |
Maximum | 3.25 |
Sum | 22461.83 |
Count | 16383 |
The data exhibits moderate variability: The standard deviation and variance show a certain degree of spread in the prices, but it's not significantly wide. The positive skewness indicates that the majority of prices are grouped at the lower end, with a tail of higher prices stretching to the right. Furthermore, a kurtosis value near zero suggests that the price distribution is close to normal, lacking pronounced peaks or tails.
BAGS DISTRIBUTION
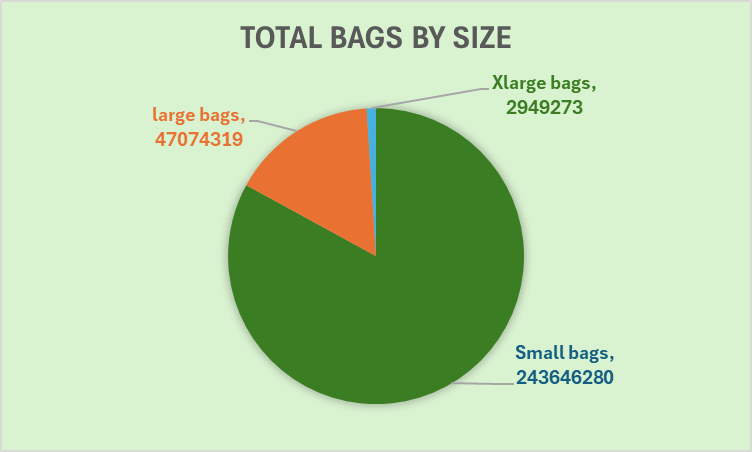
Small Bags represent the highest distribution with a total of 243,646,280. Large bags 47,074,319 and X-large bags with 2,949,273.
CONCLUSION
Total Volume: Conventional avocados represent 98% of the total volume, with a total of 3,231,422,226 units from January 2015 to March 2018. Organic Avocados represent 2% of the total volume, with 56,568,370 units. The first year had the highest volume for conventional avocados at 1,065,892,619 units. And there is a clear preference for conventional avocados over organic ones.
Average Price Analysis: The average price for conventional avocados indicates a ranged from $1.07 to $1.25, with a total average of $1.16. For Organic Avocados, prices ranged from $1.54 to $1.74, with a total average of $1.64. Organic avocados are consistently priced higher than conventional ones by approximately. Both categories show slight variations in price over time but no significant fluctuations.
City Price Variation: The price variation across different cities shows higher prices for Organic, they are consistently more expensive than conventional ones. Examples: In Hartford and Springfield, organic avocados are priced at $2.25 compared to $1.41 for conventional ones. Similar trends are observed in San Francisco and New York City.
Monthly Sales Analysis: Highest Sales in February: Totaling 1,253,668,007 units, with 1,240,973,776 conventional and 12,694,231 organics. And lowest Sales in November: Totaling 681,315,031 units, with 671,420,243 conventional and 9,894,788 organics.
Total Revenue Analysis: Conventional avocados consistently generate higher revenue compared to organic ones. The Q1 shows the highest total revenue, while Q4 shows the lowest.
Correlation with Volume: A strong positive correlation (0.986389) between total volume and total revenue suggests that higher sales volumes are closely linked to higher revenues.
Negative Correlation with Price: A weak negative correlation (-0.19197) between total volume and average price indicates that as volume increases, the average price tends to decrease slightly.
The analysis highlights a strong consumer preference for conventional avocados, reflected in both volume and revenue data. Despite the higher prices of organic avocados, their market share remains small. The stable pricing and strong correlation between volume and revenue suggest a consistent market demand, allowing for reliable planning.
RECOMMENDATION
Based on the comprehensive analysis of avocado sales from January 2015 to March 2018, the following recommendations are proposed to optimize revenue and market strategy:
Conventional avocados account for 98% of the market, reflecting a significant consumer preference. Organic avocados make up 2% of the total volume. To boost the market share for organic avocados, we suggest concentrating on consumer behavior; justifying the higher prices and implementing marketing and advertising campaigns highlighting the health advantages, such as higher nutrient content and fewer pesticides that could positively impact the environment; and this potentially led to an increase in sales. I recommend implementing this marketing and advertising campaign specially in cities where the organic avocado has the highest prices like San Francisco, New York City, Hartford and Springfield.
Boost Sales in Low Months: Implement targeted promotions and discounts in November to boost sales during the typically slower sales period. Emphasize the advantages of avocados, highlighting their nutritional benefits and their flexibility in various holiday recipes. algo given that Q1 shows the highest total revenue, intensify marketing efforts and promotional activities during this quarter to maximize revenue.
Since higher sales volumes are closely linked to higher revenues, focus on strategies that drive volume sales. This could include bulk purchase discounts, loyalty programs, etc.
DASHBOARD
This last section illustrates what the dashboard looks like:


Comments